

Costs of Owning a Home in Canada vs. Median Wages the Worst in Recorded History
A new report from RBC Economics paints a grim picture for Canadians — housing affordability in Canada is the worst it has ever been since the country was formed in 1867.

Today, the Monthly Costs to Buy a Median Single-Family Detached Home Would Eat Up 70.2% of a Typical Family’s Pre-tax Income
Its not just single detached homes that are unaffordable either, with the exception of condos, Canada is currently experiencing the worst affordability for all housing types, in all of recorded Canadian history.
To make matters even more dire, the above ‘ownership costs as a percentage of income’ data points are on a gross, pre-tax basis.
You still have to pay income tax, CPP and EI on top of these amounts.
How its Calculated, and Why Its Genius
To better understand this chart, and why its so profound, you first need to understand how its made.
For starters, RBC understood that they had to account for the time value of money; a dollar in 1990 is not worth the same as a dollar in 2024.
They accounted for this in a couple of ways:
- First, they use median household wages over time in order to equalize wage inflation. Though the dollar amounts would be different, a median earning household in 1990 would be treated the same as a median income earning family today. This ensures purchasing power consistency.
- Secondly, they use home ownership costs, including mortgages, property tax, insurance and heating to ensure that no single cost variable is able to skew the numbers. This also helps to capture the “true” cost of shelter.
Divide the Two Numbers to get a Percentage
Finally, they divide the median ownership cost of a house in Canada by the median household income to get a percentage.
A percentage is a ratio, and gets us away from using dollars entirely. A ratio, if done properly, can be timeless.
The resulting chart tells us: What percentage of a median household’s pre-tax income would be required to own a median home in Canada, at each time period.
In layman’s terms: How much of normal family’s paycheque do they have to fork-out to get a normal house?
And in 2024, its never been higher!
Canadian Housing Less Affordable Than in 1991, When Interest Rates Were 13%
What is most shocking about the report is that housing affordability in Canada is lower now than in 1991, when the Bank of Canada overnight rates peaked at 13%, as depicted in the chart below:
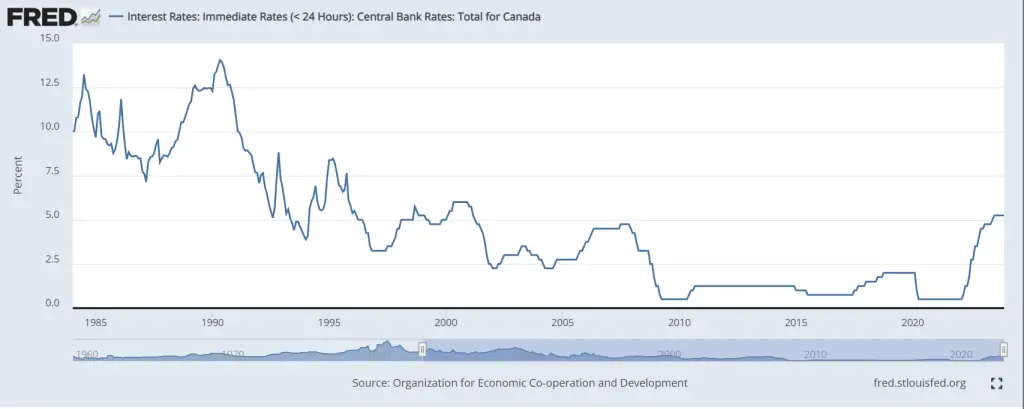
Interest Rates Aren’t As High as 1991, How Could Affordability Be Lower?
This RBC report uses monthly ownership costs as its basis for comparison. The largest component of these monthly payments is the mortgage cost.
There are two main numbers that determine a mortgage’s monthly payment:
- The interest rate
- The principal amount
(There are other variables, but RBC eliminates them by standardizing their scenarios to 25-year amortizations on 5 year terms.)
Since we know that interest rates now are lower than in 1991, we can deduce that the cost of ownership increases come as a result of the principal portion of the mortgage equation.
And this stands up to scrutiny, when we look at a chart of the inflation-adjusted cost of residential property prices in Canada, we find that they’ve skyrocketed almost 400% since the 1970s.
Remember this is after inflation:

Surging Insurance Costs Push Down Affordability as Well
As discussed in our recent article (here), homeowner’s insurance in Canada has also surged in recent years. In fact, its quadrupled since the year 2000, and is one of the fastest increasing CPI items in the Stats Canada basket.
(Blue = CPI All Items, Orange = CPI Homeowner’s Insurance)
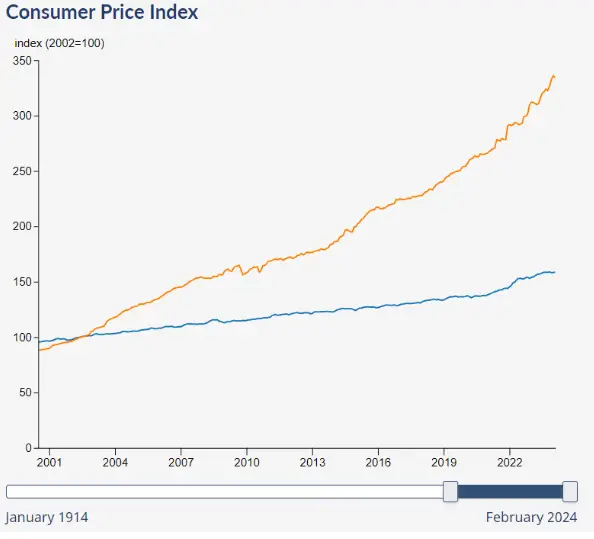
All of these variables combined: higher interest costs, higher insurance cost, higher housing prices have all contributed to this record setting environment.
The Bad News: This Situation is Unlikely to Improve in the Near-Term
The likelihood of affordability improving in the near future is diminishing by the day.
The TMX implied interest rate probabilities are now only pricing in a 66% chance of a single 25 bps Bank of Canada cut in June 2024.
Furthermore, as it relates to single family detached homeownership, we wrote an article recently highlighting that Ontario is building 72% fewer single family homes than it was at its peak in 2003.
Canadians are struggling; and there is little hope in sight. They need lower rates and more houses, and they need them now.